To see what I mean, look at the product matrix below. ESS offers three basic kits: VT1, VT2, VT3. Some of the customization hardware may be provided by ESS (such as higher boost pulley), but the customizations are not supported by ESS and at the end of the day are the customer's responsibility to install and support. Customer-installed customizations options include more boost, nitrous, stroker motors, or even a custom methanol kit. The combinations seem endless: three different kits, and many different options translates into hundreds of different possible combinations.
| Custom Boost | Custom Blower | Low Compression | Stroker Motor | Nitrous | Methanol | DCT Software | |
| VT1 | x | x | x | ||||
| VT2 | x | x | x | x | x | x | |
| VT3 | x | x | x | x | x | x | x |
There are a few items in the product matrix that need further explanation.
Even though each kit has a pre-set boost level, ESS is always willing to give
the customer a higher boost pulley (under the right circumstances). The
customer must live in an area where the appropriate gasoline is available to
meet the higher demands of the higher boost.
ESS is a reasonably large company and sells hundreds of supercharger kits. Because of their large volume, ESS has the clout to have custom-made Vortech blowers with different housing and impeller designs. I was offered a custom-made blower for a very reasonable price, but we decided that I didn't need it (yet). I didn't need it because I was not even exceeding the volume output of our existing blower. It just goes to show you: bigger is not always better (or even necessary). As far as I know, these custom-blower options are not available to any other Vortech-based kit on the market -- which means a custom-made Vortech blower for the S65 motor would only be available through ESS.
ESS does not offer a methanol injection kit nor Nitrous Oxide option. However, both are included in this product matrix to show what is possible without changing any of the ESS hardware design.
Pricing
I've seen the rumors that I received my ESS kit for free as some type of quid-pro-quo. There were three people who knew beforehand exactly how much I paid for my kit (I personally told each of them) -- and these were the same three people who started this rumor. For a while, I was willing to let the rumors circulate because I wanted to see how far they would let this go. One of the guys immediately stopped his participation after I confronted him (he didn't remember discussing the price with me), but the other two never stopped in spite of being confronted. Since the rumors seemed to take hold among a select group of people, I think it's time to address them directly.
It was never really a secret how much I paid. In fact, the exact price was contained in the following statement in the opening post of my Mojave Mile thread:
I knew tuning the stroker was going to be expensive -- probably $3000 expensive. So at that point, I honestly figured I might as well spend the extra $10k and get the blower as well and be done with it.
In other words, I purchased an ESS VT2 kit for $13,000 (MSRP $13,500) -- only $500 below list price. At this point in time, the only difference between my VT2 kit and one that you can buy directly from ESS -- is the ECU tune for the Stroker+Supercharger. Everything else in the kit -- all of the components are the same ones available to any VT2 customer.
Performance Efficiency
The Performance Efficiency (PE) of the ESS-46 kit is one of the highest if not THE highest on the market. The PE of this kit is between 5.41 - 5.48. The PE rates the kit's ability to produce power and factors out displacement, boost, and gasoline. This article provides a description and the formulas for calculating the PE of a supercharger kit.
Performance (Driving)
While driving the car home, I began the drive rather gingerly -- trying to reacquaint myself with the car and all of its power. For the first 150-200 miles, I didn't exceed 75MPH. But after driving 200 miles towards home, 75 soon turned into 80; 80 turned into 90; 90 turned into 100; and 100 eventually turned into 105 MPH. These weren't short excursions into these speeds -- these were prolonged distances at these speeds. Luckily Interestate-5 was completely deserted that night, and I always slowed down when I approached other cars. For some reason a Lincoln Continental and Mitsubishi Mirage wanted to hang with me at these speeds. Both cars followed me all the way to Highway 101 in Gilroy California.
The only way I can describe how the car ran -- was simply amazing. The sound of the motor was so intoxicating that I blame it for my upward speed ventures. Throttle response was instant and telepathic. The car knew exactly what I wanted it to do -- and was always willing to give it. The ECU tuning in the car is superb and the sound of the engine sublime. The car idles perfectly; it doesn't hunt or search for an idle speed. The car starts perfectly every time. There are never any limp modes, engine stalls, etc. It's a far cry from the problems I had with the "custom tune" I had put on the stroker. In fact, the tune on the car is night and day different -- and I think runs better than the factory ECU tune.
I am running on Michelin PS2 street tires -- nothing exotic or sticky. So at times under hard acceleration, I can feel the back-end getting a little squirrely. Recently I took my 17 year-old out for a drive (his first since the supercharger was installed). He wanted to "feel" the extra power. I told him he had better bring a diaper change -- and he informed me that he already relieved himself! Once we found our "lonely road" I opened up third gear. Within 3-4 seconds, I was already at 110 MPH. Not wanting to go any faster (with my son in the car), I slowed down -- the ride was over. I asked him if he could tell it was faster. I don't think he could get the grin off of his face -- and all he could say was "uh...yeah!"
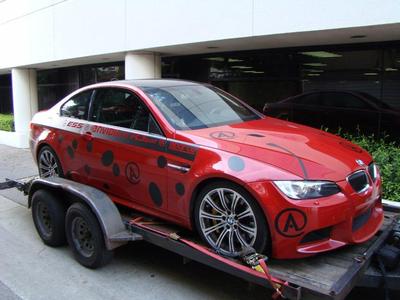
So after seven months out of my possession, I finally had a chance to drive my car back home. I'm currently using it as my daily driver. I'm driving around with my mid-boost 613whp configuration. I get far more looks, thumbs-up, and general "atta-boys" now, than I ever did before. Maybe people are seeing the roll cage and Sparco seat in the car and realize this is one serious, mean, and nasty machine.
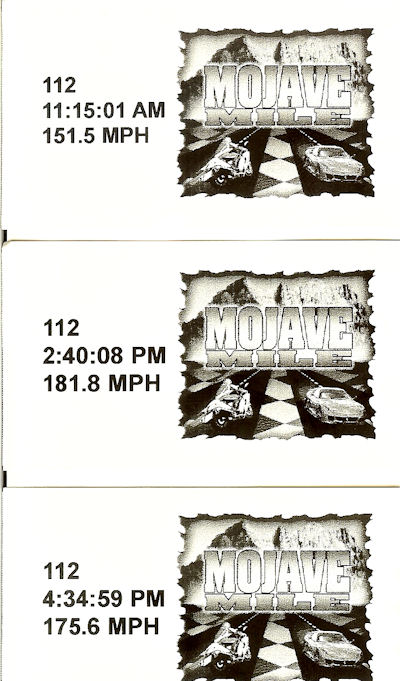
Performance (Track Driving)
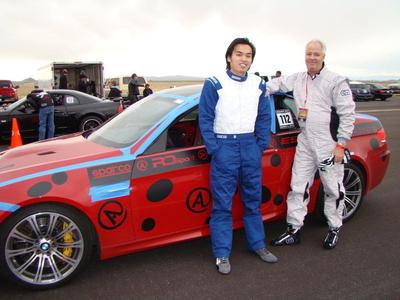
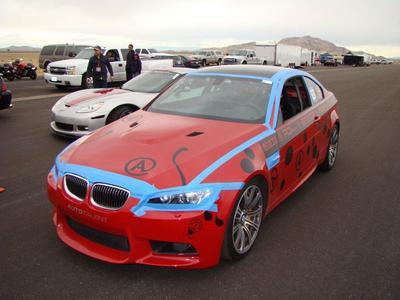
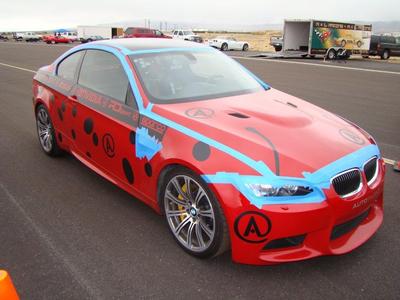
The car has been in two standing mile competitions, and the M-Fest track event. The first standing mile -- Mojave Mile -- we ran 181.8 MPH. In the Texas Mile, we increased the boost and ran 186.1 MPH before fouling our oxygen sensors two days before the end of the event. After changing the O2 sensors, we put our lowest (6PSI) boost pulley back on the car, drove it to Las Vegas for M-Fest and drove the track event. While at MFest, we tracked the car for six full track sesssions -- which if I (and others) counted correctly was -- exactly twice as many sessions as any other supercharged E9x M3 at the event. The car ran absolutely flawlessly while the ambient temperatures climbed to the mid to upper 80's. The motor's water temperature never exceeded 107 degrees (C). The first session was also my first time on a real track in 25 years. We were running on 20" Michelin PS2 street tires that were over pressurized by more than 10 PSI (stupid tire shop). Thankfully one of our guest driver's -- Earl -- checked the tire pressure and noticed it was way too high. He lowered the pressure and I immediately picked up 10+ seconds per lap on my next time out on the track. As the lap times below show, the performance was very consistent -- lap after lap -- usually within 1/2 second of each other.
| Lap-1 | Lap-2 | Lap-3 | Lap-4 | Lap-5 | Lap-6 | Lap-7 | Lap-8 | |
| Robert | 02:42.71 | 02:36.40 | 02:33.03 | 02:32.27 | 02:29.77 | 02:31.04 | 02:39.29 | 02:31.04 |
| Earl | 02:13.98 | 02:12.16 | 02:09.43 | 02:19.88 | 02:09.01 | |||
| Robert | 02:23.73 | 02:25.68 | 02:24.79 | |||||
| Sam | 02:38.67 | 02:26.92 | 02:24.00 | |||||
| Eric | 02:21.58 | 02:24.61 | 02:17.47 | 02:17.16 | 02:16.28 | |||
| Robert | 02:22.06 | 02:20.72 | 02:20.84 | 02:20.46 | 02:22.10 | 02:22.55 | 02:22.83 | 02:23.24 |
Performance (Power)
By now, we've performed three different dyno runs at three different boost levels. The first dyno runs at 6PSI demonstrated 561whp (SAE corrected.) At 6.25 boost, we achieved 601whp (SAE corrected). The final results are harder to pin down. We know the final results were 50-55whp higher than our previous runs at the Arizona dyno, but we never ran this boost on our home dyno. Our home dyno has the boost gauge and is the dyno we use for published results. So if 601whp (SAE, 613whp STD) was our previous baseline, then our final results were probably somewhere around 650-655whp (SAE, 665-670whp STD). But we will never know for sure because we don't ever plan to get back to measure this configuration on our home dyno.
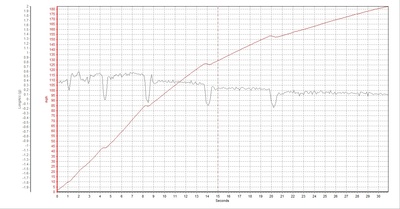
The BOOST
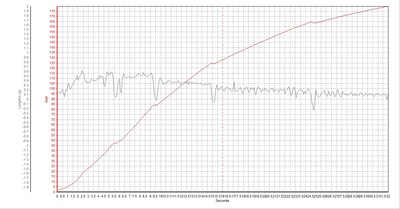
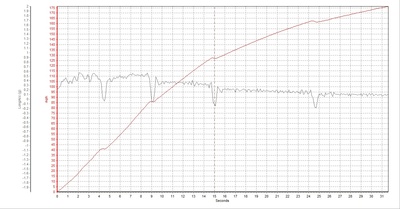
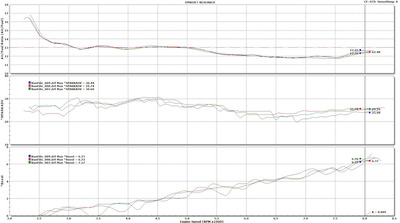
The large pulley (shown in the graph below) demonstrates that we are right at 6 PSI as the car was delivered from ESS. The smaller pulley was just barely smaller. As you can see from the graph, the trend line shows boost near 6.25 PSI -- again, very modest and very conservative setting.
BOOST: 6.0 PSI
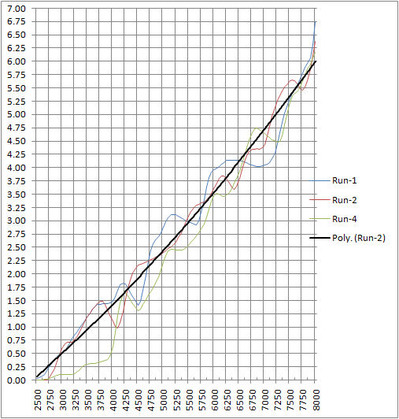
BOOST: 6.25 PSI

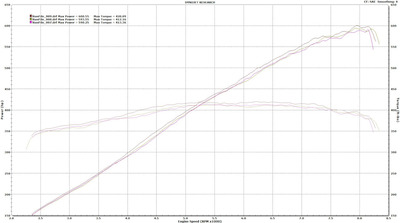
Low Boost (6.0 PSI), 91 Octane, STD Correction
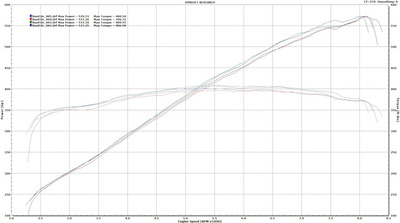
Low Boost (6.0 PSI), 91 Octane, SAE Correction
Higher Boost (6.25-6.5 PSI), 91 Octane, STD Correction
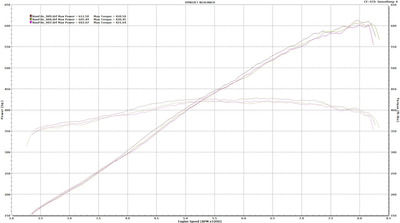
Higher Boost (6.25-6.5 PSI), 91 Octane, SAE Correction
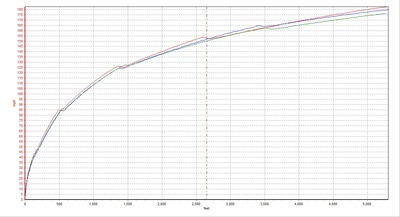
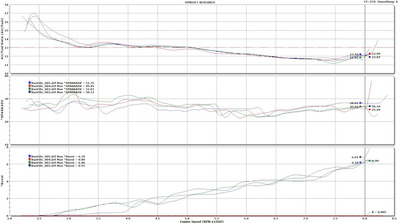
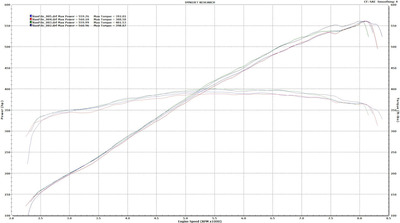
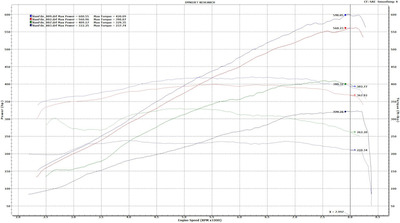
Here are the ESS-46 vs. RS-46 vs. Stock comparison dyno charts. Unfortunately, these are the only Dynojet graphs I have of the RS-46 stroker on this same dyno. It's unfortunate because these were some of the very first dyno charts taken, when the ECU was untuned by ESS, and we still had the nasty torque dip. But nonetheless, they are good for a relative comparison.
ESS-46 vs. RS-46 vs. Stock Comparison, 91 Octane, STD Correction

ESS-46 vs. RS-46 vs. Stock Comparison, 91 Octane, SAE Correction
Videos:
I took some videos with the iPhone. There's not the best quality, but they are something.
605 whp run
612 whp run
Gas Mileage
Life before the stroker motor was simple. I achieved 16.5 MPG in the city, and up to 21.7 MPG on the highway. Adding the stroker motor changed all of that. I was down to 14.5 MPG in the city, and 16.5 MPG on the highway. Changing my differential increased my mileage substantially -- and adding the supercharger increased it a little more. Now, I'm back to 21-22 MPG on the highway. Since I rarely (never) have my car at home any longer, I do not have any in-city driving MPG specifications.
Oil Consumption
I was always a little disappointed with my oil consumption. Before the supercharger, my stroker motor was consuming one quart of oil per 1600-2000 miles. That is well within BMW specifications, but too much for my happiness. However, while installing the supercharger, we did perform a leakdown test on my motor -- just to be safe. All of my cylinders were well within normal leakdown ranges -- in fact the leakdown numbers were very low. Adding the supercharger has substantially decreased my oil consumption. Now I'm consuming 1-quart of oil per 3000-4000 miles. My belief is that the positive pressure inside the cylinder is not allowing the oil (under the vacuum of an NA motor) to get past the rings. Basically it's the difference between positive pressure in the cylinder (FI) versus a vacuum in the cylinder (NA).
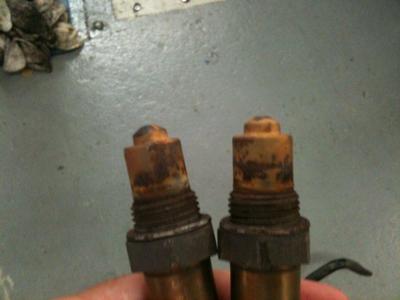
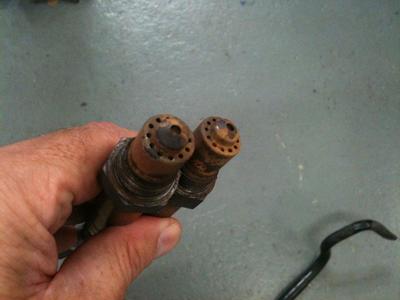
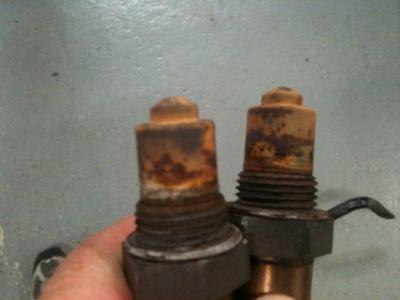
Problems
We have been hard on O2 sensors -- VERY hard on them. In Texas, we blew through a set of O2 sensors when we ran Q16 leaded gas at some pretty high boost. After getting home, we swapped the O2 sensors, put on our lowest boost pulley, and drove the car to MFest to have some fun at the track event. However as soon as we got back, we had some unfinished business to attend to: we wanted to know exactly how much power we were making in our Texas Mile configuration. So, we put on our high boost pulley, filled her up with MS109 and started driving the car around really hard. Within 100 miles, the DME started cutting spark just like it did when we fouled the O2's with Q16. So we took her to the dyno anyways to see if we could get a better picture of what was going on.
But while at the dyno, I learned something very interesting about the MSS60 DME. When an O2 sensor fails, the DME does not reduce redline, but it does enter a safe mode of sorts. After the first run, I noticed that the car seemed to take longer to rev between 2000-8400 RPMs, and we were down 100whp on power from what I expected. Then when I looked closer, I saw the AFR and SPARK data at a constant fixed amount -- meaning it didn't change all the way from 2000-8400 RPMs. So I called Asbjorn @ ESS and told him what I saw (this was before we knew we had an O2 sensor problem). He immediately knew we had entered a special type of safe mode because he informed me that the DME will set a constant spark and AFR target without reducing the redline. So we left the dyno without any results.
Once we ran some diagnostics on the car, we discovered that we had a faulty O2 sensor on bank-1. We went to the BMW dealership to pick up another set (even though only one was malfunctioning) and asked the dealer if the O2 sensors have a warranty. We knew the standard response would be that electronic devices do not have a warranty -- and this is exactly what we were told. However, if the CAR is under warranty and a replacement O2 sensor fails -- even though it may have been replaced by a non-BMW service center -- then the part would still be covered. All we had to do was bring in the car to BMW. They would look over the car; make sure it had not been modified or raced; and then proceed to cover the warranty for the O2 sensors. At that point Sam@AutoTalent and I looked at each other and said "we're screwed." On the way out, we joked that we wouldn't even bother trying to get them replaced under warranty. But after replacing the faulty O2 sensor, the car has run absolutely flawlessly.
Customer Service
ESS has been amazing to work with. They have been fast and responsive with every request I've made. The car has been to their Arizona facility twice -- once for the initial kit installation, and once for an upgrade tune before heading out to Texas. Today I'm still running that same tune. ESS set me up with three different pulleys: low, low-medium, and medium-high boost. The tune they created in the ECU will accommodate all of these boost configuration without reflashing -- provided I increase the octane rating of the gasoline to match the boost level. That special ECU tune was a special request of mine -- no "map switching" required -- because I didn't want to ship the ECU back to Arizona for reflashing every time I changed pulleys. So, Asbjorn pulled the rabbit out of his hat and figured out a way to program the ECU for multiple boost levels. It's worked: the tune on the motor is amazing.
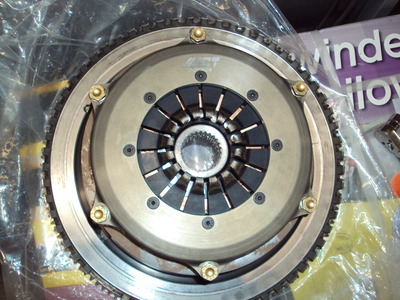
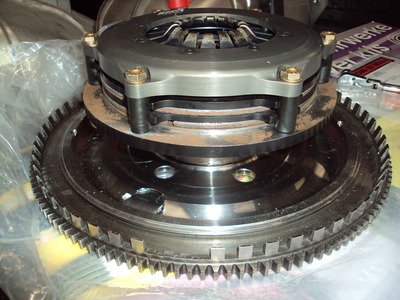
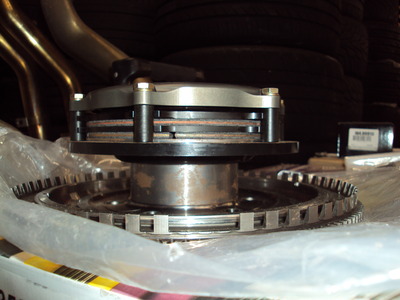
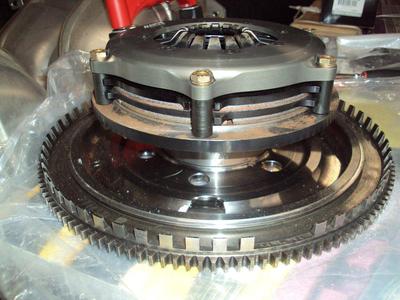
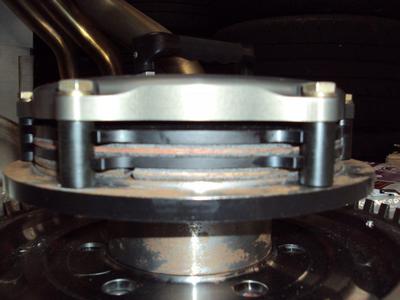
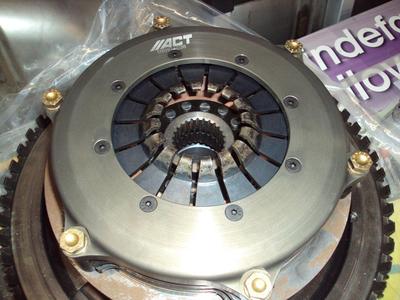
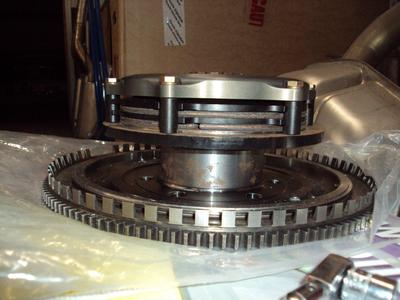
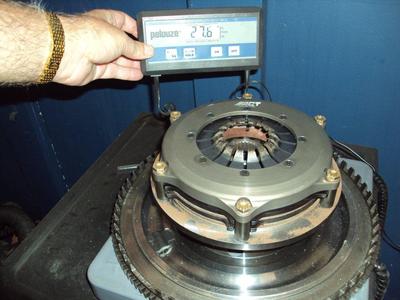
What's Next
Now that I have a high performance clutch to install on the car, I plan to have the car sent back to Auto Talent in a few weeks. We'll install the clutch and figure out ways to tweak the aerodynamics of the car for our Mojave Mile and Texas Mile events. After seeing "trauma" those types of events put on the car, I'm not so sure I want to compete at Bonneville. Bonneville would certainly cause a bit more trauma to the car. I would need to install a fuel cell, fuel cut-off, electrical cut-off, and 6-point roll cage (cutting into the dash board). I'm just not willing to tear up the car to that extent.
So for now, my car has two seats: Sparco with 6-point harness in the driver's side, and OEM and seat belt on the passenger side. The car is loud inside and is unsuitable for talking on the cell phone above 45 MPH. But when I step on the gas, the roar of that motor comes to life. It is the meanest sounding beast on the road I've ever heard. While cruising around it sounds very tame -- but when you hit the gas and go through a few gears, the tame pussycat turns into a full-on beast.
]]>